Motor License Fund Non-Restricted Revenues
By Gueorgui Tochev , Senior Budget Analyst | 5 years ago
Transportation Analyst: Gueorgui Tochev, Senior Budget Analyst
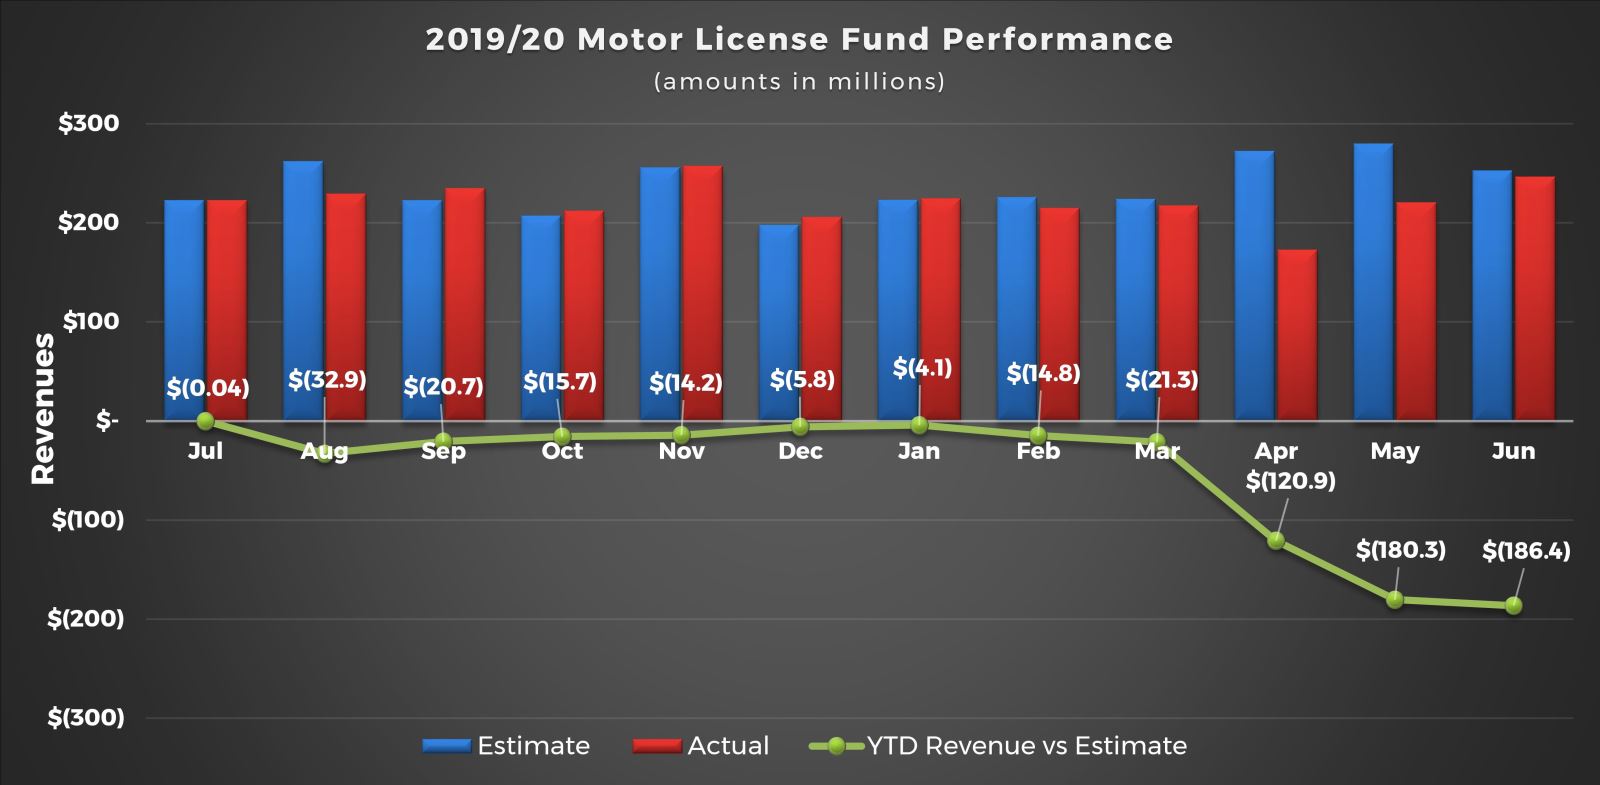
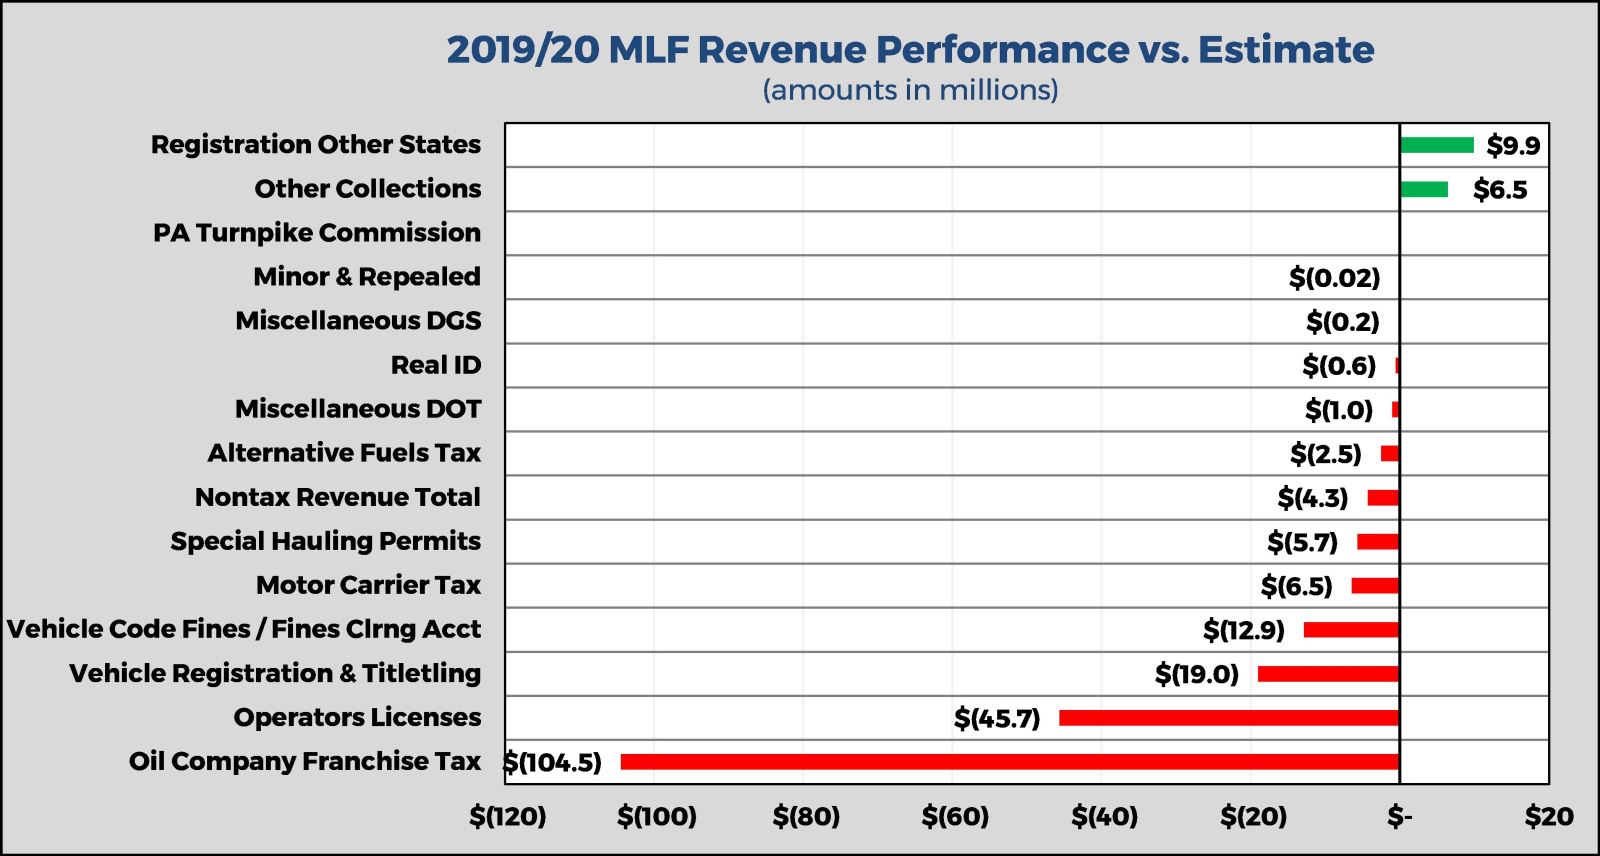
The COVID-19 pandemic, along with its economic repercussions, has created an immediate need to reassess how we fund our roads and bridges. Decreased demand on fuels and fewer registrations and titling led to lower than estimated Motor License Fund (MLF) non-restricted revenues. As it currently stands, the majority of revenues come from Liquid Fuels taxes and more specifically the Oil Company Franchise Tax (OCFT). This particular segment of MLF revenues ended FY 2019/20 $104.5 million below estimate. OCFT revenues are comprised of a combination of millage associated with gasoline/diesel. For FY 2019/20, revenues ended $186.4 million, or 6.5 percent, below estimates.
The table below provides a top-level depiction of the different MLF components and compares FY 2019/20 Revenues vs. Estimate:
| MOTOR LICENSE FUND (MLF) |
| 2019/20 Non-Restricted Revenues: Performance vs. Estimate |
| (amounts in millions) |
| Type |
Estimate |
Collections |
$ Difference |
% Difference |
| MLF TOTAL |
$ 2,849.9 |
$ 2,663.5 |
$ (186.4) |
-6.5% |
| Liquid Fuels Total |
$ 1,821.9 |
$ 1,708.4 |
$ (113.5) |
-6.2% |
| Motor Carrier Tax |
$ 135.4 |
$ 128.9 |
$ (6.5) |
-4.8% |
| Alternative Fuels Tax |
$ 15.5 |
$ 13.0 |
$ (2.5) |
-16.3% |
| Oil Company Franchise Tax |
$ 1,671.0 |
$ 1,566.5 |
$ (104.5) |
-6.3% |
| Minor & Repealed |
$ - |
$ (0.02) |
$ (0.02) |
|
| Licenses and Fees |
$ 1,008.6 |
$ 954.0 |
$ (54.6) |
-5.4% |
| Special Hauling Permits |
$ 38.1 |
$ 32.4 |
$ (5.7) |
-15.0% |
| Registration Other States |
$ 145.0 |
$ 154.9 |
$ 9.9 |
6.9% |
| Operators Licenses |
$ 91.5 |
$ 45.8 |
$ (45.7) |
-49.9% |
| Real ID |
$ 27.4 |
$ 26.8 |
$ (0.6) |
-2.1% |
| Vehicle Registration & Titletling |
$ 765.8 |
$ 746.8 |
$ (19.0) |
-2.5% |
| Other Collections |
$ (59.2) |
$ (52.7) |
$ 6.5 |
-10.9% |
| Other Motor Receipts |
$ 3.2 |
$ (10.9) |
$ (14.1) |
-439.8% |
| Misc Code Fines / Departments |
$ 3.2 |
$ (10.9) |
$ (14.1) |
-439.8% |
| Nontax Revenue Total |
$ 16.2 |
$ 11.9 |
$ (4.3) |
-26.7% |
| * Portion of Vehicle Code Fines are distributed to the jurisdiction originating from a particular fine, resulting adjustments contribute to a negative year-end balance on occasion |
The following two graphics illustrate the cumulative performance and the differences between the monthly revenue collections versus estimates:


Any fiscal year revenue comparison would not be complete unless contrasted to the prior fiscal year’s performance. FY 2019/20 revenues ended $185.8 million, or 7 percent, below FY 2018/19 receipts. The following table gives an additional layer for comparison:
| MOTOR LICENSE FUND (MLF) |
| Non-Restricted Revenues: 2019/20 vs 2018/19 Performance |
| (amounts in millions) |
| Type |
2019/20 |
2018/19 |
$ Difference |
% Difference |
| MLF TOTAL |
$ 2,663.5 |
$ 2,849.3 |
$ (185.8) |
-7.0% |
| Liquid Fuels Total |
$ 1,708.4 |
$ 1,837.2 |
$ (128.7) |
-7.5% |
| Motor Carrier Tax |
$ 128.9 |
$ 134.0 |
$ (5.0) |
-3.9% |
| Alternative Fuels Tax |
$ 13.0 |
$ 15.6 |
$ (2.6) |
-20.2% |
| Oil Company Franchise Tax |
$ 1,566.5 |
$ 1,687.6 |
$ (121.1) |
-7.7% |
| Minor & Repealed |
$ (0.02) |
$ 0.02 |
$ (0.04) |
185.1% |
| Licenses and Fees |
$ 954.0 |
$ 992.4 |
$ (38.3) |
-4.0% |
| Special Hauling Permits |
$ 32.4 |
$ 37.1 |
$ (4.7) |
-14.6% |
| Registration Other States |
$ 154.9 |
$ 138.8 |
$ 16.1 |
10.4% |
| Operators Licenses |
$ 45.8 |
$ 71.5 |
$ (25.7) |
-56.1% |
| Real ID |
$ 26.8 |
$ 4.6 |
$ 22.2 |
82.7% |
| Vehicle Registration & Titletling |
$ 746.8 |
$ 730.4 |
$ 16.4 |
2.2% |
| Other Collections |
$ (52.7) |
$ 9.9 |
$ (62.6) |
118.7% |
| Other Motor Receipts |
$ (10.9) |
$ 3.6 |
$ (14.5) |
133.3% |
| Misc Code Fines / Departments |
$ (10.9) |
$ 3.62 |
$ (14.5) |
133.3% |
| Nontax Revenue Total |
$ 11.9 |
$ 16.1 |
$ (4.2) |
-35.2% |
| * Portion of Vehicle Code Fines are distributed to the jurisdiction originating from a particular fine, resulting adjustments contribute to a negative year-end balance on occasion |