General Fund Revenue Report - January 2024
By Brittany Van Strien , Budget Analyst | 2 years ago
Tax & Revenue Analyst: Adrian Buckner, Budget Analyst
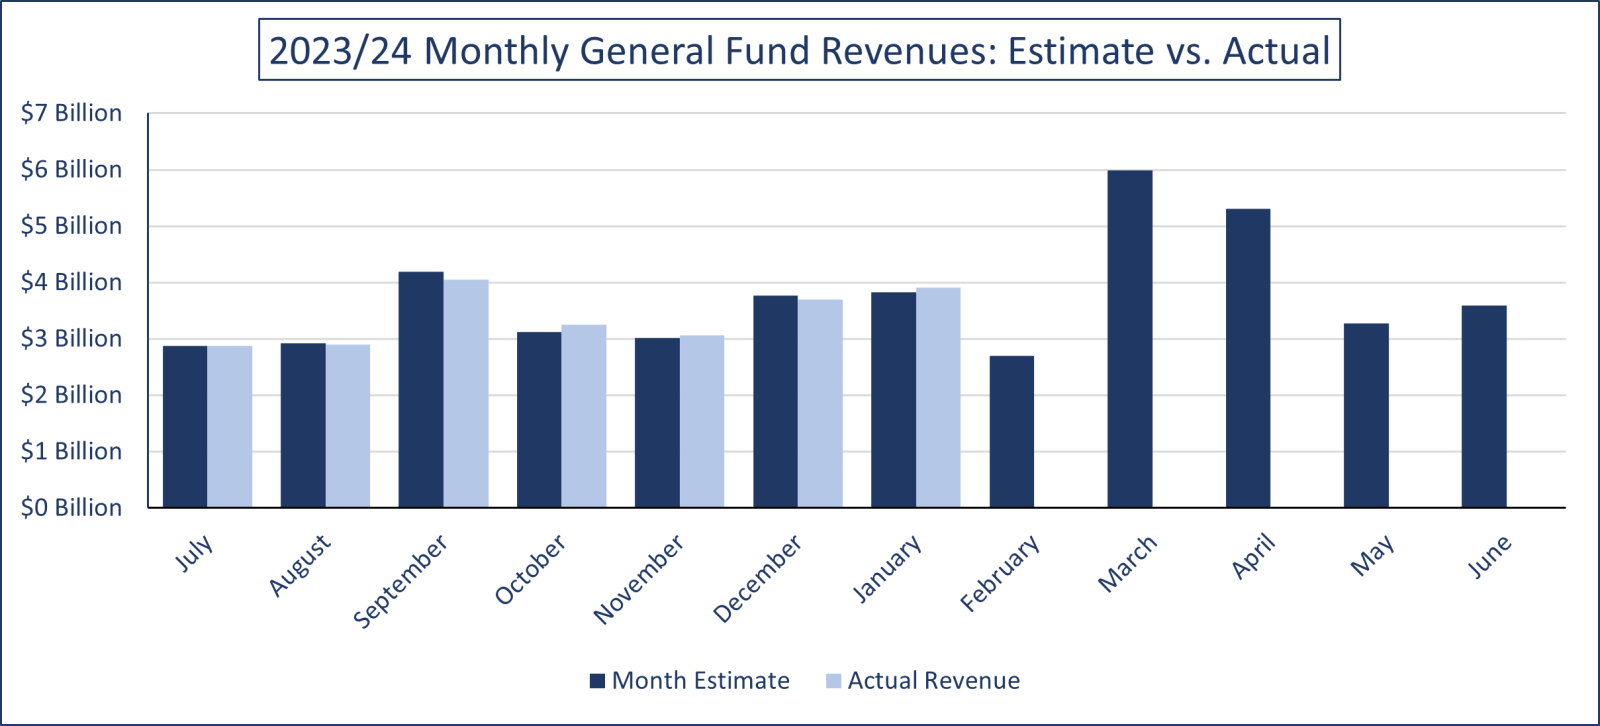
General Fund revenues in January were $74.6 million or 1.9% higher than expected.
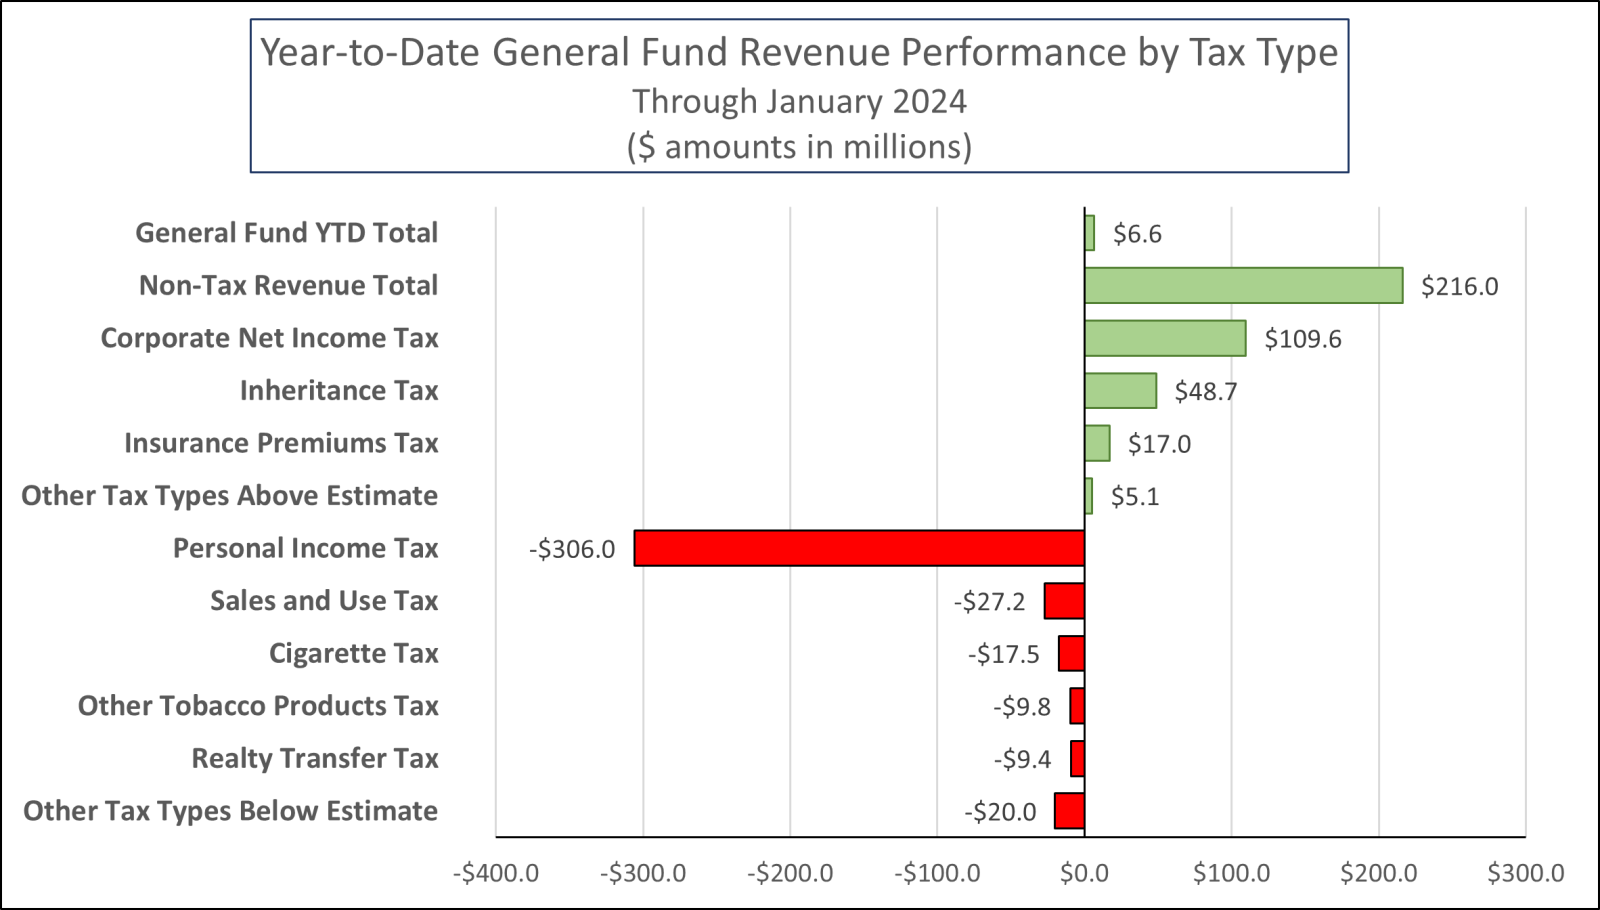
For the Year-to-date, General Fund revenues are $6.6 million or 0.03% above estimate.
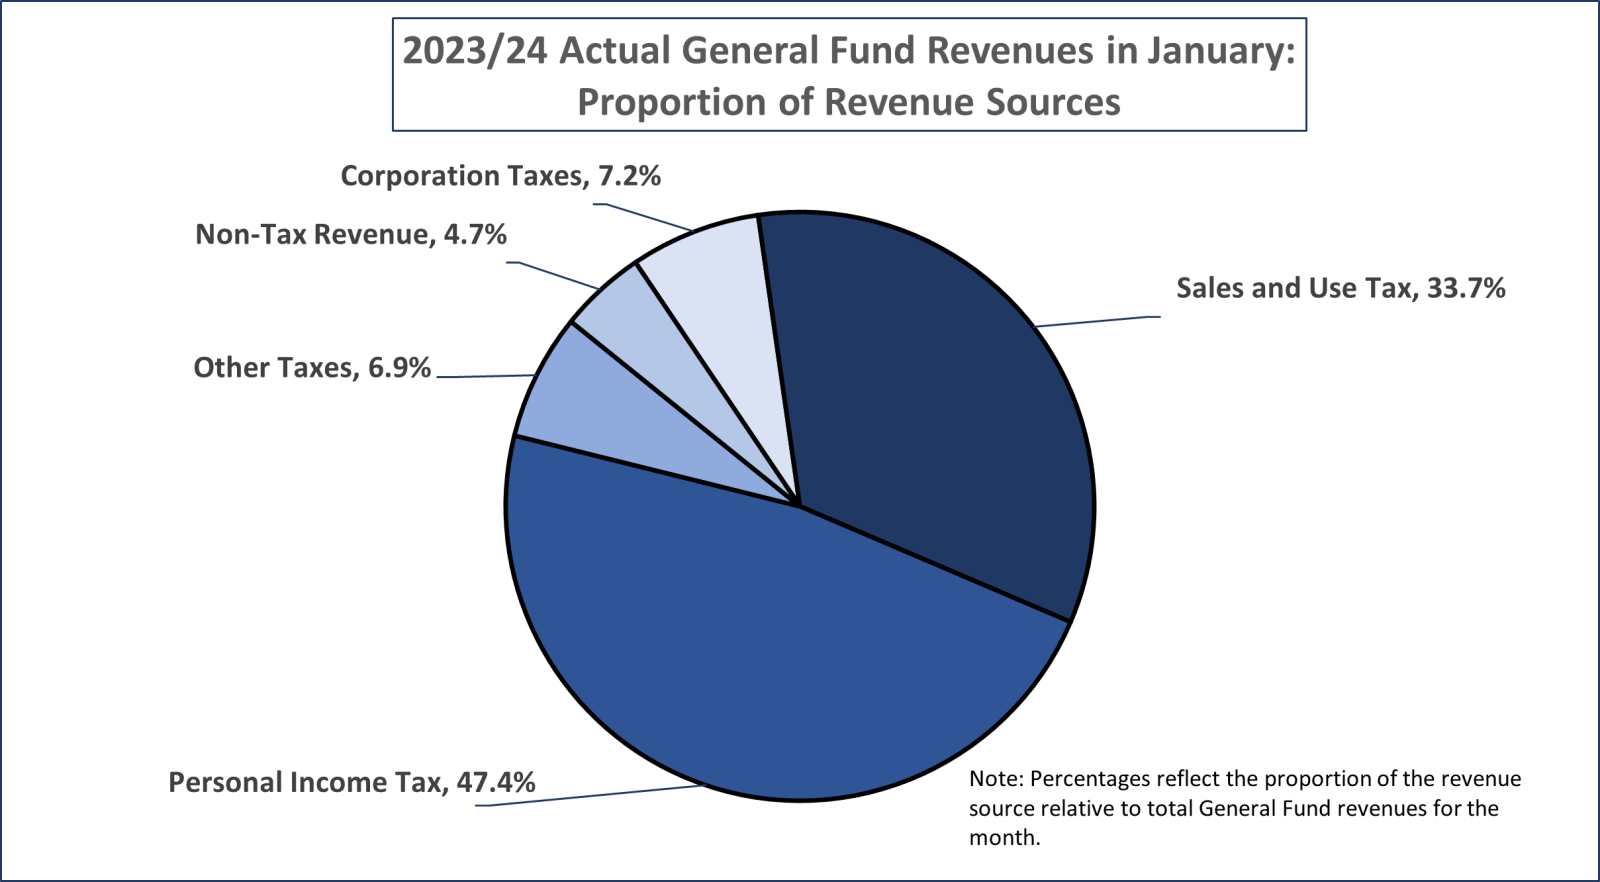
Sales and Use Tax (SUT) revenue outperformed projections for the month by $89.0 million or 7.2%. Collections from nonmotor vehicle sales were the main contributor to this higher-than-expected revenue in January, finishing the month $88.0 million or 7.8% over estimate. Collections from motor vehicle sales were $1.0 million or 1.0% more than estimated. These collections in January bring the year-to-date SUT revenue performance to $27.2 million or 0.3% under estimate.
Corporate Net Income Tax (CNIT) revenue also finished the month $35.2 million or 20.1% above projections. For the year-to-date, CNIT collections are $109.6 million or 4.0% more than estimated. Similarly, non-tax revenue finished $136.2 million or 275.8% more than expected in January, largely due to more interest income than projected for the month and fiscal year.
Personal Income Tax revenue in January was $183.3 million or 9.0% under estimate. For the year-to-date. PIT collections are underperforming by $306.0 million or 3.2%.
Looking ahead, Governor Shapiro will present his 2024/25 Executive Budget proposal on Tuesday, February 6. The House Appropriations Committee will begin budget hearings with agencies on Tuesday, February 20.
|
2023/24 General Fund Revenues ($ amounts in millions)
|
|
|
January 2024 Revenues
|
Year-to-Date Revenues
|
|
|
Month Estimate
|
Month Revenues
|
$ Difference
|
% Difference
|
YTD Estimate
|
YTD Revenues
|
$ Difference
|
% Difference
|
|
General Fund Total
|
$3,833.5
|
$3,908.1
|
$74.6
|
1.9%
|
$23,746.3
|
$23,752.9
|
$6.6
|
0.03%
|
|
Tax Revenue
|
$3,784.1
|
$3,722.5
|
($61.6)
|
-1.6%
|
$23,223.0
|
$23,013.7
|
($209.3)
|
-0.9%
|
|
Corporation Taxes:
|
|
Corporate Net Income Tax
|
$175.2
|
$210.4
|
$35.2
|
20.1%
|
$2,742.7
|
$2,852.3
|
$109.6
|
4.0%
|
|
Gross Receipts Tax
|
$5.0
|
$5.9
|
$0.9
|
18.8%
|
$26.3
|
$28.3
|
$2.0
|
7.5%
|
|
Public Utility Realty Tax*
|
$0.0
|
$0.0
|
$0.0
|
0.0%
|
$1.2
|
$2.3
|
$1.1
|
94.2%
|
|
Insurance Premiums Taxes
|
$51.3
|
$61.9
|
$10.6
|
20.7%
|
$53.5
|
$70.5
|
$17.0
|
31.8%
|
|
Financial Institution Taxes
|
$0.6
|
$2.1
|
$1.5
|
252.9%
|
$27.0
|
$29.0
|
$2.0
|
7.4%
|
|
Consumption Taxes:
|
|
Sales and Use Tax
|
$1,227.9
|
$1,316.9
|
$89.0
|
7.2%
|
$8,521.9
|
$8,494.7
|
($27.2)
|
-0.3%
|
|
Cigarette Tax
|
$41.3
|
$34.6
|
($6.7)
|
-16.2%
|
$456.7
|
$439.2
|
($17.5)
|
-3.8%
|
|
Other Tobacco Products Tax
|
$13.9
|
$12.1
|
($1.8)
|
-13.1%
|
$95.7
|
$85.9
|
($9.8)
|
-10.2%
|
|
Malt Beverage Tax
|
$1.5
|
$1.6
|
$0.1
|
3.8%
|
$13.2
|
$12.5
|
($0.7)
|
-5.4%
|
|
Liquor Tax
|
$33.1
|
$29.8
|
($3.3)
|
-9.9%
|
$277.5
|
$269.6
|
($7.9)
|
-2.8%
|
|
Other Taxes:
|
|
Personal Income Tax
|
$2,037.4
|
$1,854.1
|
($183.3)
|
-9.0%
|
$9,682.5
|
$9,376.5
|
($306.0)
|
-3.2%
|
|
Realty Transfer Tax
|
$42.4
|
$47.4
|
$5.0
|
11.8%
|
$310.3
|
$300.9
|
($9.4)
|
-3.0%
|
|
Inheritance Tax
|
$118.4
|
$105.0
|
($13.4)
|
-11.4%
|
$826.0
|
$874.7
|
$48.7
|
5.9%
|
|
Gaming Taxes
|
$33.8
|
$36.4
|
$2.6
|
7.6%
|
$214.2
|
$210.4
|
($3.8)
|
-1.8%
|
|
Minor and Repealed
|
$2.3
|
$4.3
|
$2.0
|
87.9%
|
($25.7)
|
($33.3)
|
($7.6)
|
-29.5%
|
|
Non-Tax Revenue
|
$49.4
|
$185.6
|
$136.2
|
275.8%
|
$523.3
|
$739.3
|
$216.0
|
41.3%
|
|
*Note: Actual Public Utility Realty Tax collections in January were $23,518.
|