Impact Fee and Natural Gas Production
By Gueorgui Tochev , Senior Budget Analyst | 4 years ago
Environment & Energy Analyst: Gueorgui Tochev, Senior Budget Analyst
Notwithstanding COVID-19 and the associated economic disruptions, 2020 was another record year for natural gas production in Pennsylvania. Despite another production milestone, the Act 13 impact fee in calendar year 2020 was $146.25 million -- $54.1 million less than 2019.
Industry support groups and opponents of the impact fee, view Act 13 of 2012 as legislation that imposes a “burdensome tax” on the natural gas industry. They focus on the total amount of fees imposed, since Act 13 became law (first imposed calendar year 2011), rather than the fact that 2020’s fee is the lowest on record.
A review of the impact fee also requires an explanation of how fee collections are determined. Specifically, impact fees paid by each producer are determined by a multi-year fee schedule, based on the average annual price of natural gas. The following table shows all potential fee levels per unconventional well, as described in Act 13 of 2012, based on gas prices each year. Once a year, a fee is assigned to each well and is dependent upon the number of years a well has been in operation and the average annual price of gas as defined by the act.
| Unconventional Gas Well Fee Schedule |
Average Annual Price of Natural Gas |
| $0.00 - 2.25 |
$2.26 - 2.99 |
$3.00 - 4.99 |
$5.00 - 5.99 |
$6.00+ |
| Year 1 |
$ 40,000 |
$ 45,000 |
$ 50,000 |
$ 55,000 |
$ 60,000 |
| Year 2 |
$ 30,000 |
$ 35,000 |
$ 40,000 |
$ 45,000 |
$ 55,000 |
| Year 3 |
$ 25,000 |
$ 30,000 |
$ 30,000 |
$ 40,000 |
$ 50,000 |
| Years 4-10 |
$ 10,000 |
$ 15,000 |
$ 20,000 |
$ 20,000 |
$ 20,000 |
| Years 11-15 |
$ 5,000 |
$ 5,000 |
$ 10,000 |
$ 10,000 |
$ 10,000 |
| Note: Vertical well fees are 20% of horizontal well fees. Vertical wells are not subject to year 11-15 payments. |
| The average annual price of natural gas is defined as the arithmetic mean of the New York Mercantile |
| Exchange (NYMEX) settled price for the near-month contract as reported by the Wall Street Journal for the |
| last trading day of each month of a calendar year for the 12-month period ending December 31. |
|
To explore the divergent paths in which the impact fee and natural gas production are headed, we can evaluate the “burden” of the fee. Such evaluation requires a per-calendar-year analysis of:
- production levels and impact fee collections
- impact fee collections and a calculation of the effective tax rate (ETR)
Production increases have outpaced collections every year since 2011. In comparing the difference in terms of percentage increase, the large discrepancy supports the notion of a lessening financial “burden” on producers and ongoing calls for enacting a severance tax.
| CY 2011 - 2020 Pennsylavania Nat'l Gas Production |
| |
2011 |
2012 |
2013 |
2014 |
2015 |
2016 |
2017 |
2018 |
2019 |
2020 |
| Well Type |
bcf |
bcf |
bcf |
bcf |
bcf |
bcf |
bcf |
bcf |
bcf |
bcf |
| Unconventional |
1,066 |
2,043 |
3,103 |
4,070 |
4,601 |
5,096 |
5,364 |
6,123 |
6,821 |
7,092 |
| Conventional |
240 |
218 |
162 |
176 |
163 |
112 |
101 |
101 |
121 |
89 |
| Combined |
1,305 |
2,261 |
3,265 |
4,247 |
4,764 |
5,208 |
5,465 |
6,225 |
6,942 |
7,181 |
|
|
|
|
|
|
|
|
|
|
|
| Impact Fee (millions) |
$ 204.21 |
$ 202.47 |
$ 225.75 |
$ 223.50 |
$ 187.71 |
$ 173.26 |
$ 209.56 |
$ 251.83 |
$ 200.36 |
$ 146.25 |
As we explore the different trajectories of production and impact fee revenues, we cannot help but sit in awe of production milestones reached year-after-year. In a year when entire industries and their employees could not work, the natural gas industry in Pennsylvania was not only able sustain its existence but excel.
| Year |
Unconventional Well Production
(bcf) |
Yr-over-Yr Production Change |
Impact Fee
(millions) |
Yr-over-Yr Impact Fee Change |
| 2011 |
1,066 |
|
$ 204 |
|
| 2012 |
2,043 |
92% |
$ 202 |
-1% |
| 2013 |
3,103 |
52% |
$ 226 |
11% |
| 2014 |
4,070 |
31% |
$ 224 |
-1% |
| 2015 |
4,601 |
13% |
$ 188 |
-16% |
| 2016 |
5,096 |
11% |
$ 173 |
-8% |
| 2017 |
5,364 |
5% |
$ 210 |
21% |
| 2018 |
6,123 |
14% |
$ 252 |
20% |
| 2019 |
6,821 |
11% |
$ 200 |
-20% |
| 2020 |
7,092 |
4% |
$ 146 |
-27% |
| Change since 2011 |
565% |
|
-28% |
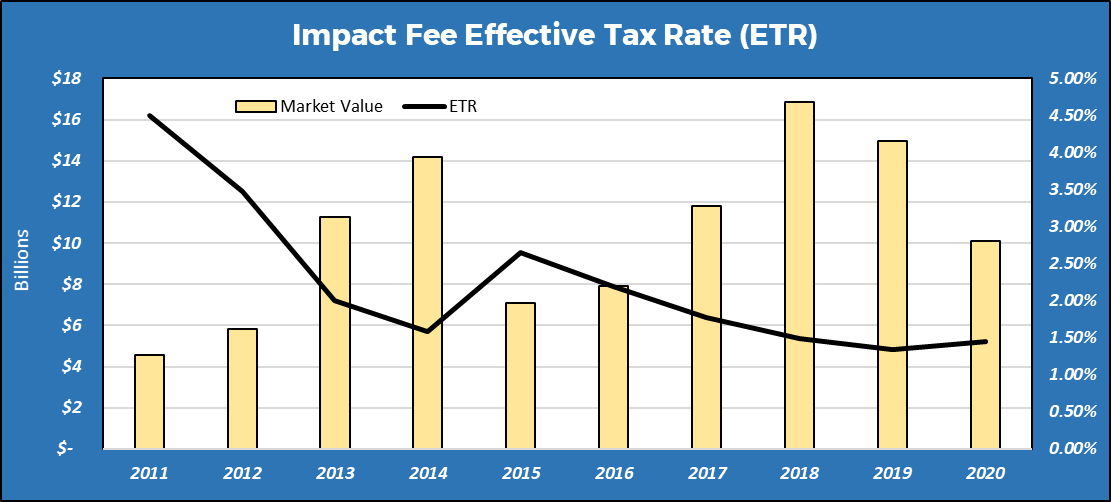
As we continue our impact fee analysis, next we can look at calculating an effective tax rate. The rate’s calculation is a function of the annual impact fee, production, and the resulting market value for a particular calendar year.
The effective tax rate (ETR) for the impact fee shows that for 2020, the industry had its lowest “burden.” A graphic illustration of the ETR emphasizes the evolution of unconventional well production in Pennsylvania and the respective ETR as calculated by the House Democratic Appropriations Committee (HACD).
|
|
Impact Fee and Effective Tax Rate |
|
|
CY |
Impact Fee(1) |
Production(2) (mcf) |
Market Value
(MV) |
ETR(3) |
|
|
2011 |
$ 204,210,000 |
1,065,824,046 |
$ 4,538,151,847 |
4.50% |
|
|
2012 |
$ 202,472,000 |
2,043,360,704 |
$ 5,838,597,436 |
3.47% |
|
|
2013 |
$ 225,752,000 |
3,102,890,307 |
$ 11,266,209,483 |
2.00% |
|
|
2014 |
$ 223,500,000 |
4,070,390,209 |
$ 14,167,431,796 |
1.58% |
|
|
2015 |
$ 187,711,700 |
4,600,905,454 |
$ 7,076,806,042 |
2.65% |
|
|
2016 |
$ 173,258,900 |
5,096,092,075 |
$ 7,928,042,207 |
2.19% |
|
|
2017 |
$ 209,557,300 |
5,363,470,514 |
$ 11,809,316,198 |
1.77% |
|
|
2018 |
$ 251,830,900 |
6,123,395,616 |
$ 16,848,328,224 |
1.49% |
|
|
2019 |
$ 200,364,500 |
6,821,125,285 |
$ 14,967,446,696 |
1.34% |
|
|
2020 |
$ 146,254,725 |
7,092,048,086 |
$ 10,080,154,937 |
1.45% |
|
|
|
|
|
|
|
| Notes: |
|
|
|
|
|
| (1) |
Impact Fee Data: PUC website, July 2021 |
|
|
|
| (2) |
Production Data: DEP website, July 2021 |
|
|
|
| (3) |
Effective Tax Rate (ETR) is calculated by dividing the Market Value (MV), as determined by HACD, |
|
by Impact Fee collections |
|
|
|